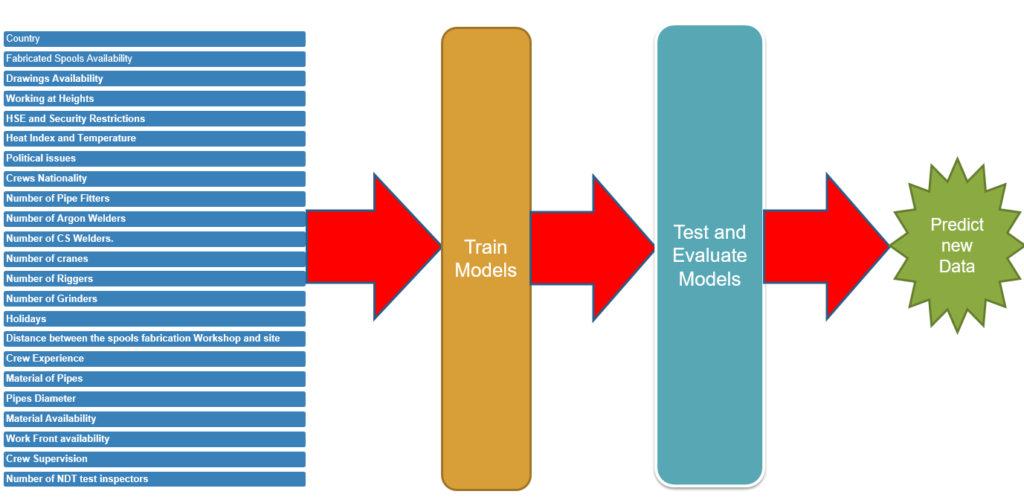
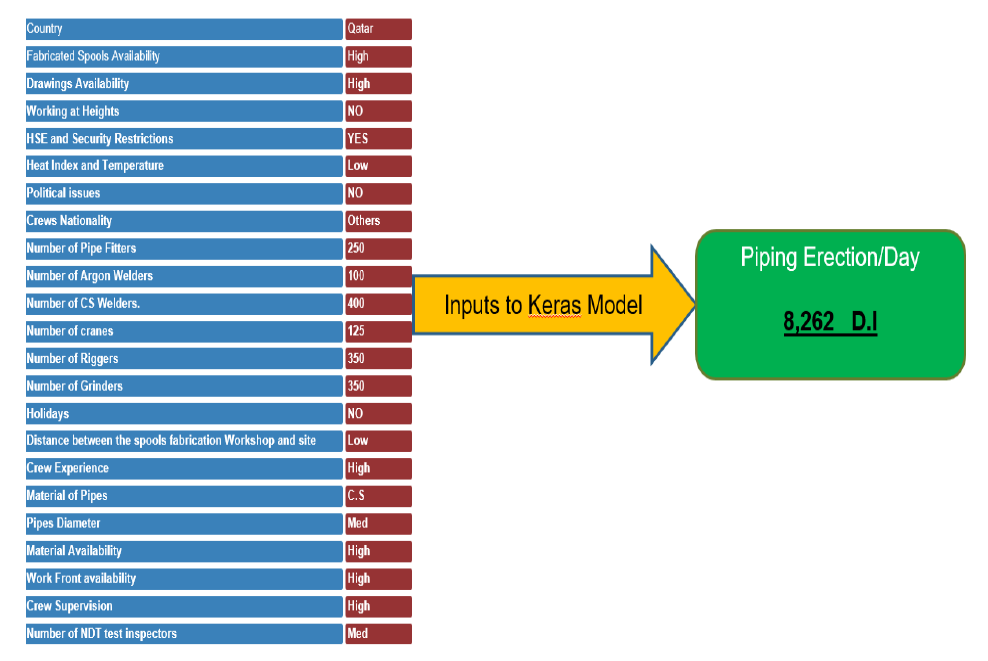
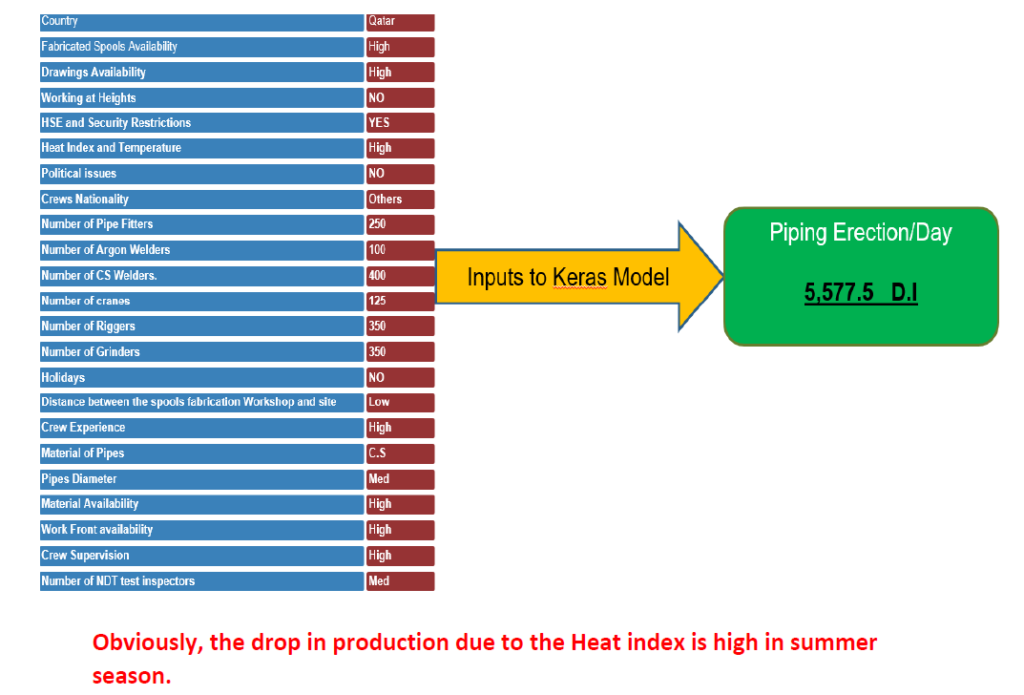
We have utilized a predictive Model to predict the Piping spools erection, daily production and the features that impact the piping erection productivity in industrial and oil and gas projects depending on historical data.
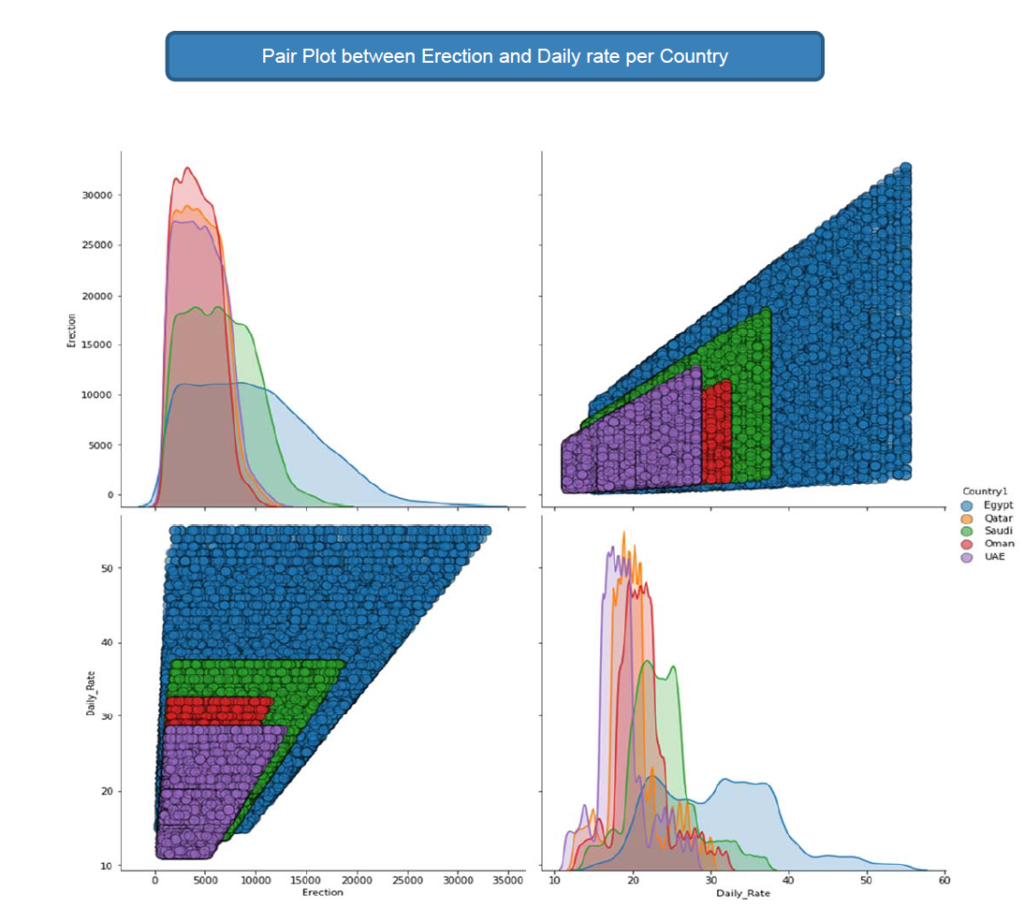
Data Visualization
The histogram/Line on the diagonal allows us to see the distribution of a single variable while the scatter plots on the upper and lower triangles show the relationship between two variables.
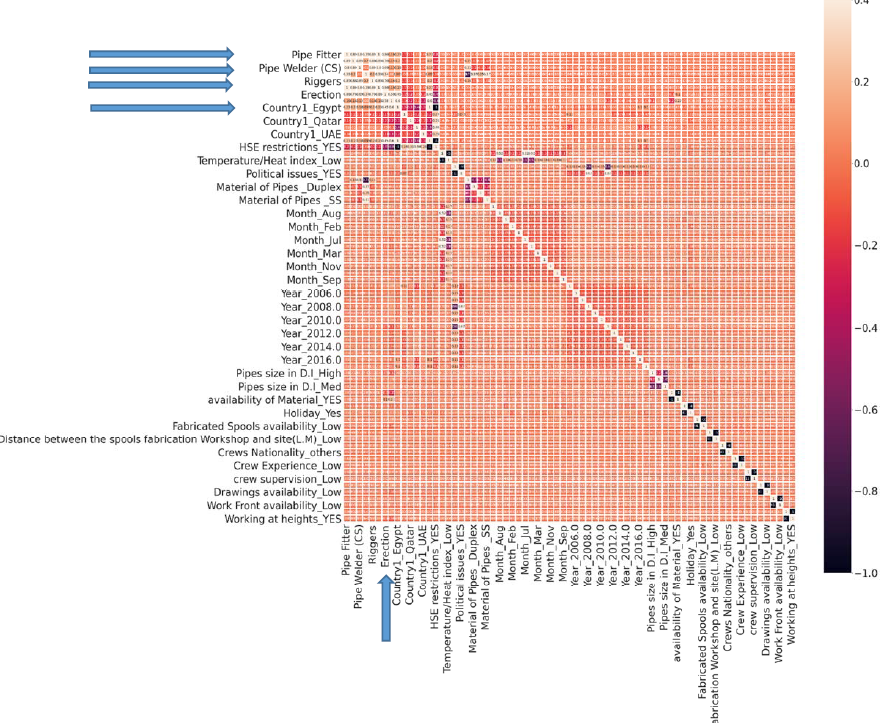
Heat Map: Identifying and Weighing Influential Features